Started in 2011, public beta in early 2012, update to version 1.0 in November 2012, now crossing an notable number in terms of usage. 10 Million is huge. And we are so happy and proud about pulling that off.
Let's do this..
There is a thing to be said about the background story, about connections to people who are like-minded, who do not fear working with technology and pursuing goals together.
Nicolas Kayser-Bril is a good example. I first got a note from Ulrike Langer, who is well-known media journalist in Germany (who recently moved to the US, but keeps on working in this space). She said: "Mirko, you got to meet Nicolas. My guess is, you guys will get along well". That was in early 2010.
From Amsterdam to Paris to Bonn to Berlin
As a result of that introduction, Nicolas was invited to that conference I organized with Liliana for the European Journalism Centre, to be happening in Amsterdam. That was a great project, the first where we worked together with Liliana. Met Stijn. Met Simon. Met Lorenz Matzat. Ah, and Jonathan. Tony Hirst. Alan McLean. Eric Ulken. We had 16 speakers on that one day and they all saw each other, most for the first time ever. An unplanned, but great outcome of the Amsterdam #ddj round-table was that the one day meeting established first, loose ties between people who all labeled themselves "renegades" in some way. People interested in journalism, data and telling stories, essentially.
Later in 2010 I visited an event organized by Lorenz Matzat in Berlin, which was coding with Python for journalists. That's where I first met Gregor Aisch. Looked into his work. Saw his drive for cool combinations of code, numbers and visualizations, which is unique in many ways.
Early in 2011 I sent out a tweet as an reaction to others debating roles of data people in newsrooms. I wanted to first define a goal and wrote something like "first of all newsrooms need to understand that it's not about attention, but about trust". So, we wrote an article together with Gheoff McGhee who was part of that Twitter discusssion, which was published on Nieman Labs.
Datawrapper got traction when Beate Füth from ABZV in Bonn provided the budget. After loosing the first two developers on that project and a lot of time, he said: "So, you essentially want to cut down time needed for a chart to zero". Me: "Yes, excatly." So Nicolas put together the beta for that tool in like four, five weeks. And we launched in early 2012. On the first day of availability the people over at Ruhrnachrichten in Dortmund, Germany, published a first chart on their website, although we never had talked before.
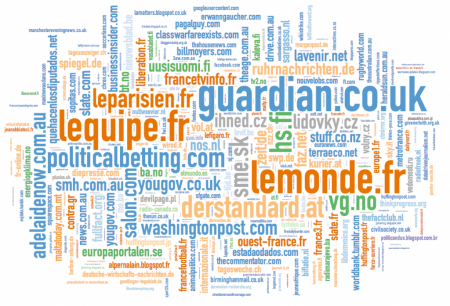
It went on like a positive daisy chain: The Guardian Data Blog started using Datawrapper, which was a big step for the project. And so on. And so on. Essentially, I guess that can be said, we succeeded in what we wanted to do: Close a gap, make it easier to use data for journalists.
Building data-driven journalism networks
Nicolas went on to found Journalism++. He asked whether I wanted to be a minority partner. Then, in the next step, we got that idea of combining different, small teams working on data-driven journalism into a wider network - sharing the same name, working together, but in the areas and people networks that we know through decades. So, in came Jens Finnas from Sweden. This is just great. It is a chain of positive events unfolding around professional needs, people wanting to work with each other and pulling it off.
Yes, it's about data. But, it's about people, too.
So, in this story there is a lot of name dropping. But I hope you get the point. Yes, we work in technology. But it's the people around you that really matter.
Data-driven journalism is essentially about tapping into a source of power for reporting. Often, when we see big headlines about economic turmoil, changes in society, even wars - no one has a clue. We are just watching how events unfold. Using data can often uncover why something is happening and how it effects everyone.
So, the Datawrapper project besides being technological, visually interesting and good quality taught me a thing about how modern work teams can connect and work together meaningfully. Which is the best part of this.